Multiple Choice
The figure below shows the short-run aggregate supply curve of an economy.If P3 is the price level prevailing in the economy,_____.
Figure 10.1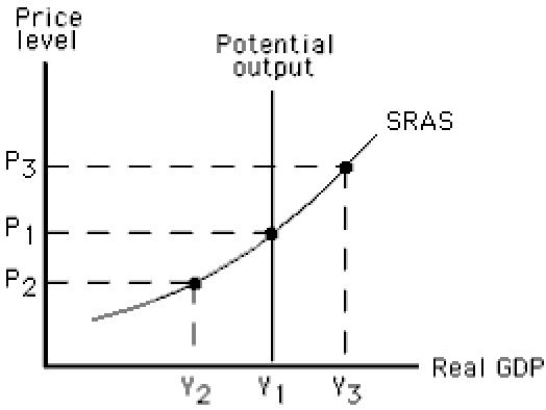
A) there is an expansionary gap.
B) there is a recessionary gap.
C) the price level will rise.
D) the actual unemployment rate is above the natural rate.
E) potential output is greater than actual output.
Correct Answer:

Verified
Correct Answer:
Verified
Q2: In the aggregate demand-aggregate supply model,which of
Q24: Which of the following is most likely
Q41: The figure given below depicts long run
Q42: The figure given below depicts long-run equilibrium
Q42: In the long run,a decrease in aggregate
Q45: The figure below shows the determination of
Q52: The fact that some resource prices are
Q73: The potential output of an economy is
Q83: Potential output is the amount produced when:<br>A)firms'
Q133: Actual output can exceed the economy's potential