Multiple Choice
The figure given below depicts long-run equilibrium in the aggregate demand-aggregate supply model.The movement from Y1 to Y2in this figure could have been caused by a:
Figure 10.9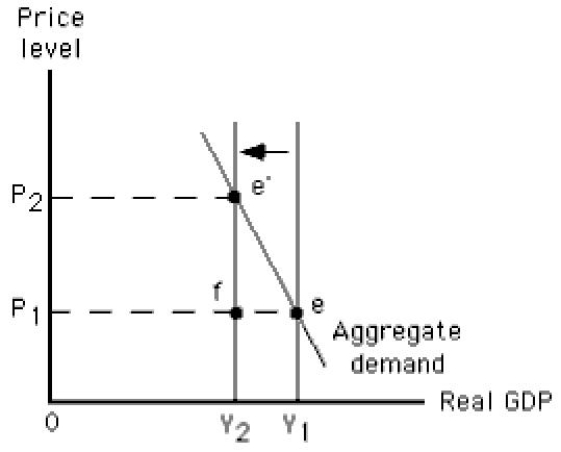
A) decrease in the size of the labor force.
B) decrease in the price level.
C) positive level of net investment.
D) increase in autonomous consumption.
E) decrease in autonomous consumption.
Correct Answer:

Verified
Correct Answer:
Verified
Q24: Which of the following is most likely
Q41: The figure given below depicts long run
Q44: The figure below shows the short-run aggregate
Q45: The figure below shows the determination of
Q52: The fact that some resource prices are
Q73: The potential output of an economy is
Q75: In the long run,the price level in
Q83: Potential output is the amount produced when:<br>A)firms'
Q125: Which of these is not assumed to
Q133: Actual output can exceed the economy's potential