Multiple Choice
The figure given below depicts long run equilibrium in an aggregate demand-aggregate supply model.Which of these could have caused the movement shown in this figure?
Figure 10.8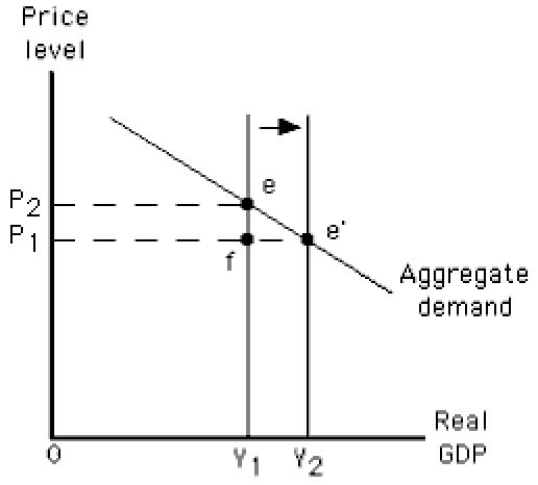
A) A decrease in the size of the labor force
B) An increase in the price level
C) An increase in net investment
D) An increase in autonomous consumption
E) A decrease in autonomous consumption
Correct Answer:

Verified
Correct Answer:
Verified
Q24: Which of the following is most likely
Q42: The figure given below depicts long-run equilibrium
Q44: The figure below shows the short-run aggregate
Q45: The figure below shows the determination of
Q73: The potential output of an economy is
Q75: In the long run,the price level in
Q83: Potential output is the amount produced when:<br>A)firms'
Q90: If the actual price level is lower
Q125: Which of these is not assumed to
Q133: Actual output can exceed the economy's potential