Multiple Choice
The figure given below shows equilibrium in a money market.When the money supply curve shifts from S to S',the equilibrium interest rate and quantity of money changes to: Figure 15.2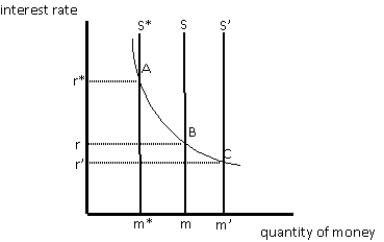
A) r and m,respectively.
B) r* and m*,respectively.
C) r' and m',respectively.
D) r and m',respectively.
E) r' and m*,respectively.
Correct Answer:

Verified
Correct Answer:
Verified
Q8: The figure given below shows equilibrium in
Q9: Planned investment expenditures will eventually decrease after:<br>A)the
Q9: The figure given below shows the aggregate
Q14: If the value of the spending multiplier
Q24: The demand for money will be high
Q27: An increase in the nominal interest rate,other
Q41: Which of the following changes is most
Q85: Given an upward sloping aggregate supply curve,which
Q96: In an economy in which real output
Q112: A decrease in the money supply in