Multiple Choice
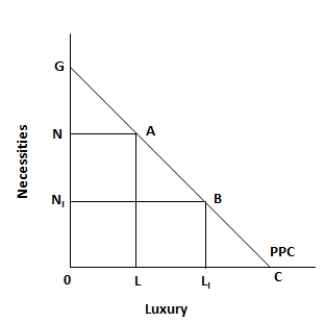
Figure 5.1. The figure shows a linear production possibility curve representing a tradeoff faced by a country, between necessities and luxuries. 
-Which of the following is a possible drawback of horizontal fracking?
A) A fall in the cost of recovering natural gas and oil
B) An increase in the price of gas and oil as a result of a decline in the supply of natural gas and oil
C) A fall in imports of natural gas and oil
D) A fall in environmental exploitation due to the means employed to extract oil
E) An increase in harmful air emissions, water contamination, and problems associated with the disposal of harmful waste fluids
Correct Answer:

Verified
Correct Answer:
Verified
Q41: Figure 5.1. The figure shows a linear
Q42: Figure 5.2. The figure shows the supply
Q43: Figure 5.3. The figure shows the wage
Q44: Figure 5.2. The figure shows the supply
Q45: Figure 5.1. The figure shows a linear
Q47: Figure 5.3. The figure shows the wage
Q48: Scenario 4-1<br>In a given year, country A
Q49: Figure 5.2. The figure shows the supply
Q50: Figure 5.3. The figure shows the wage
Q51: Figure 5.3. The figure shows the wage