Multiple Choice
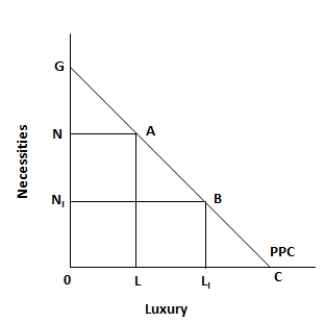
Figure 5.1. The figure shows a linear production possibility curve representing a tradeoff faced by a country, between necessities and luxuries. 
-Refer to figure 5.1. Assume that the economy is initially at point G on the production possibility curve. To consume an amount of luxury good, shown by the distance O to L, the country will have to give up a quantity of necessity good, indicated by the distance _____.
A) G to NI
B) G to N
C) N to A
D) A to B
E) NI to B
Correct Answer:

Verified
Correct Answer:
Verified
Q40: Figure 5.2. The figure shows the supply
Q41: Figure 5.1. The figure shows a linear
Q42: Figure 5.2. The figure shows the supply
Q43: Figure 5.3. The figure shows the wage
Q44: Figure 5.2. The figure shows the supply
Q46: Figure 5.1. The figure shows a linear
Q47: Figure 5.3. The figure shows the wage
Q48: Scenario 4-1<br>In a given year, country A
Q49: Figure 5.2. The figure shows the supply
Q50: Figure 5.3. The figure shows the wage