Multiple Choice
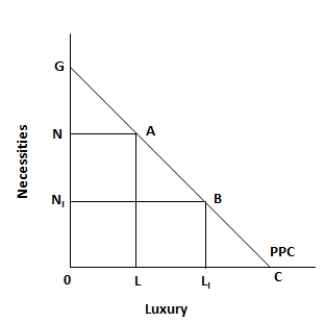
Figure 5.1. The figure shows a linear production possibility curve representing a tradeoff faced by a country, between necessities and luxuries. 
-When people make choices that (at the time and with the information they have at their disposal) give them the greatest amount of satisfaction, they are said to be:
A) behaving irrationally.
B) applying econometric models to their everyday behavior.
C) living under a communist dictator.
D) acting in their own self-interest.
E) showing no willingness to plan for the future.
Correct Answer:

Verified
Correct Answer:
Verified
Q36: Figure 5.2. The figure shows the supply
Q37: Figure 5.2. The figure shows the supply
Q38: Figure 5.3. The figure shows the wage
Q39: Figure 5.2. The figure shows the supply
Q40: Figure 5.2. The figure shows the supply
Q42: Figure 5.2. The figure shows the supply
Q43: Figure 5.3. The figure shows the wage
Q44: Figure 5.2. The figure shows the supply
Q45: Figure 5.1. The figure shows a linear
Q46: Figure 5.1. The figure shows a linear