Multiple Choice
Figure 5.2. The figure shows the supply and demand curves of a firm. 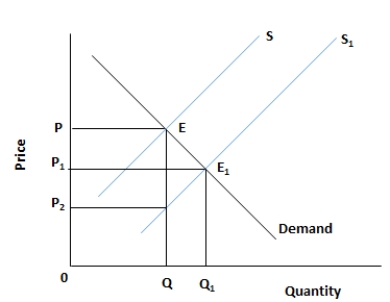
-Which of the following statements is true?
A) Minimum wage creates a labor deficit in a market.
B) Minimum wage intends to increase the consumer surplus.
C) Minimum wage is a wage set below the equilibrium wage in order to create more job opportunities.
D) Minimum wage harms the unskilled workers between the age group 40 and 50.
E) Minimum wage harms the unskilled workers between the age group 16 and 19.
Correct Answer:

Verified
Correct Answer:
Verified
Q39: Figure 5.2. The figure shows the supply
Q40: Figure 5.2. The figure shows the supply
Q41: Figure 5.1. The figure shows a linear
Q42: Figure 5.2. The figure shows the supply
Q43: Figure 5.3. The figure shows the wage
Q45: Figure 5.1. The figure shows a linear
Q46: Figure 5.1. The figure shows a linear
Q47: Figure 5.3. The figure shows the wage
Q48: Scenario 4-1<br>In a given year, country A
Q49: Figure 5.2. The figure shows the supply