Multiple Choice
Figure 5.2. The figure shows the supply and demand curves of a firm. 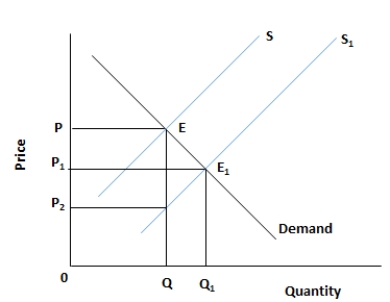
-Which of the following statements is true?
A) Over time, when demand for health care continues to rise relatively more than supply, the cost of health care falls.
B) Over time, when demand for health care continues to rise relatively more than supply , the cost of health care continues to rise.
C) An increase in the demand for health care is accompanied by an outward shift in the supply curve.
D) The price of health care rises either with a fall in demand or an increase in supply.
E) The change in the demand for health care with no change in supply causes the price to fall continuously.
Correct Answer:

Verified
Correct Answer:
Verified
Q35: Figure 5.2. The figure shows the supply
Q36: Figure 5.2. The figure shows the supply
Q37: Figure 5.2. The figure shows the supply
Q38: Figure 5.3. The figure shows the wage
Q39: Figure 5.2. The figure shows the supply
Q41: Figure 5.1. The figure shows a linear
Q42: Figure 5.2. The figure shows the supply
Q43: Figure 5.3. The figure shows the wage
Q44: Figure 5.2. The figure shows the supply
Q45: Figure 5.1. The figure shows a linear