Multiple Choice
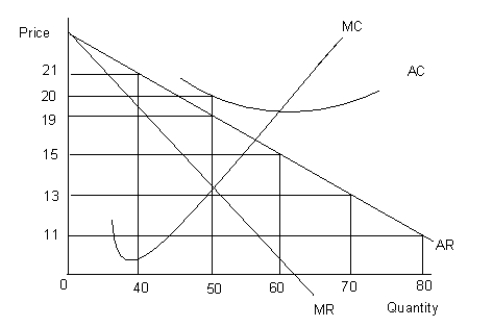
The figure given below shows the revenue and cost curves of a firm. MC represents the marginal cost curve, AC the average cost curve, MR the marginal revenue curve, and AR the average revenue curve.Figure 9.4

-A monopolistically competitive firm faces a relatively-elastic demand curve as compared to a monopolist firm because of the:
A) presence of a large number of buyers and barriers to entry.
B) presence of a large number of firms and easy entry into the market.
C) production of perfectly homogeneous products.
D) production of unique products and the presence of barriers to entry.
E) production of goods that are perfect complements of each other.
Correct Answer:

Verified
Correct Answer:
Verified
Q36: The following graph shows the demand and
Q37: The figure given below shows the revenue
Q38: Scenario 9.2<br>Consider a publicly held firm (one
Q39: The figure given below shows the revenue
Q40: Scenario 9.2<br>Consider a publicly held firm (one
Q42: The figure given below shows the revenue
Q43: The following graph shows the demand and
Q44: The table given below reports the marginal
Q45: The following graph shows the marginal revenue
Q46: The table given below reports the marginal