Multiple Choice
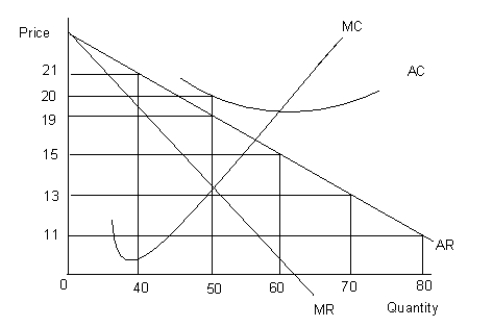
The figure given below shows the revenue and cost curves of a firm. MC represents the marginal cost curve, AC the average cost curve, MR the marginal revenue curve, and AR the average revenue curve.Figure 9.4

-Under perfect competition, at the profit-maximizing level of output:
A) price is greater than marginal revenue.
B) price is equal to marginal revenue.
C) marginal revenue is equal to zero.
D) the marginal revenue curve is upward sloping.
E) the average revenue curve is upward sloping.
Correct Answer:

Verified
Correct Answer:
Verified
Q37: The figure given below shows the revenue
Q38: Scenario 9.2<br>Consider a publicly held firm (one
Q39: The figure given below shows the revenue
Q40: Scenario 9.2<br>Consider a publicly held firm (one
Q41: The figure given below shows the revenue
Q43: The following graph shows the demand and
Q44: The table given below reports the marginal
Q45: The following graph shows the marginal revenue
Q46: The table given below reports the marginal
Q47: The following figure shows the cost and