Multiple Choice
The figure given below shows the revenue and cost curves of a perfectly competitive firm.Figure 10.1
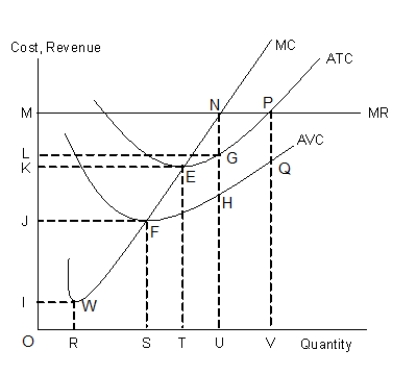
-In Figure 10.1, the firm's profit is equal to the area:
A) OIWR.
B) JKEF
C) OKET
D) LMNG
E) OJFS
Correct Answer:

Verified
Correct Answer:
Verified
Related Questions
Q32: The figure given below shows the revenue
Q33: Scenario 9.2<br>Consider a publicly held firm (one
Q34: The figure given below shows the aggregate
Q35: The figure given below shows the aggregate
Q36: The figure given below shows the revenue
Q38: The figure given below shows the revenue
Q39: The figure given below shows the aggregate
Q40: The figure given below shows the revenue
Q41: The following figure shows equilibrium at the
Q42: The following figure shows equilibrium at the