Multiple Choice
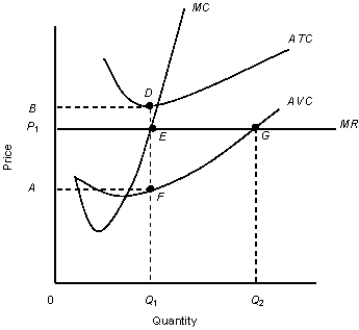
The figure given below shows the revenue and cost curves of a perfectly competitive firm.Figure 10.5
 MC: Marginal cost curve
MR: Marginal revenue curve.ATC: Average-total-cost curve
AVC: Average-variable-cost curve
-Under perfect competition, entry of new firms into the market in the long run tends to:
A) raise the aggregate supply.
B) raise the level of profit of the existing firms.
C) raise the aggregate demand for goods.
D) reduce the degree of competitiveness in the market.
E) reduce the market power of the existing firms.
Correct Answer:

Verified
Correct Answer:
Verified
Q31: The table given below shows the total
Q32: The figure given below shows the revenue
Q33: Scenario 9.2<br>Consider a publicly held firm (one
Q34: The figure given below shows the aggregate
Q35: The figure given below shows the aggregate
Q37: The figure given below shows the revenue
Q38: The figure given below shows the revenue
Q39: The figure given below shows the aggregate
Q40: The figure given below shows the revenue
Q41: The following figure shows equilibrium at the