True/False
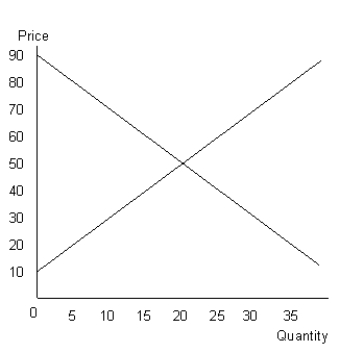
The figure given below shows the aggregate demand and supply curves of a perfectly competitive market.Figure 10.7

-When a perfectly competitive firm's demand curve lies above its average total cost curve, the firm incurs an economic loss at that level of output.
Correct Answer:

Verified
Correct Answer:
Verified
Related Questions
Q30: The table given below shows the total
Q31: The table given below shows the total
Q32: The figure given below shows the revenue
Q33: Scenario 9.2<br>Consider a publicly held firm (one
Q34: The figure given below shows the aggregate
Q36: The figure given below shows the revenue
Q37: The figure given below shows the revenue
Q38: The figure given below shows the revenue
Q39: The figure given below shows the aggregate
Q40: The figure given below shows the revenue