Multiple Choice
Use the following to answer questions :
Figure: Demand and Supply of Shirts 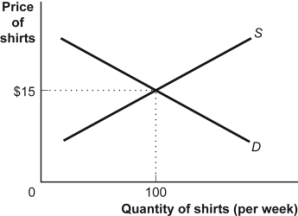
-(Figure: Demand and Supply of Shirts) Look at the figure Demand and Supply of Shirts. In the graph, if the line labeled D shows how many shirts per week will be demanded at various prices, then it is clear that as the price of shirts falls:
A) fewer shirts will be demanded.
B) more shirts will be demanded.
C) the same quantity of shirts will be demanded.
D) it is unclear what will happen to the demand for shirts.
Correct Answer:

Verified
Correct Answer:
Verified
Q65: If two points on a graph are
Q66: Use the following to answer questions :<br>Figure:
Q67: If a supply curve is represented by
Q68: If two variables are positively related, on
Q69: Professor Macro wants to use a numerical
Q70: Use the following to answer questions :
Q72: A bar graph:<br>A)shows the relative amounts attributable
Q73: In a time-series graph, large changes can
Q74: Use the following to answer questions :<br>Figure:
Q75: Your boss asks you to graph company