Multiple Choice
Use the following to answer questions : 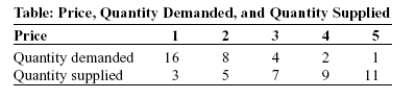
-(Table: Price, Quantity Demanded, and Quantity Supplied) Look at the table Price, Quantity Demanded, and Quantity Supplied. The slope of the line representing the relationship between price on the vertical axis and quantity demanded on the horizontal axis is:
A) equal to 1/2.
B) equal to 1.
C) equal to 2.
D) different at different points on the line.
Correct Answer:

Verified
Correct Answer:
Verified
Q65: If two points on a graph are
Q66: Use the following to answer questions :<br>Figure:
Q67: If a supply curve is represented by
Q68: If two variables are positively related, on
Q69: Professor Macro wants to use a numerical
Q71: Use the following to answer questions :<br>Figure:
Q72: A bar graph:<br>A)shows the relative amounts attributable
Q73: In a time-series graph, large changes can
Q74: Use the following to answer questions :<br>Figure:
Q75: Your boss asks you to graph company