Multiple Choice
Use the following to answer questions :
Figure: Slope 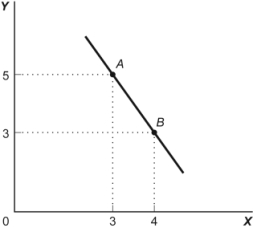
-(Figure: Slope) Look at the figure Slope. The slope of the line in the graph can be calculated by:
A) dividing the horizontal change by the vertical change.
B) dividing the vertical change by the horizontal change.
C) subtracting the sum of the Y values from the sum of the X values.
D) adding the sum of the X values to the sum of the Y values.
Correct Answer:

Verified
Correct Answer:
Verified
Q65: If two points on a graph are
Q66: Use the following to answer questions :<br>Figure:
Q67: If a supply curve is represented by
Q68: If two variables are positively related, on
Q69: Professor Macro wants to use a numerical
Q70: Use the following to answer questions :
Q71: Use the following to answer questions :<br>Figure:
Q72: A bar graph:<br>A)shows the relative amounts attributable
Q73: In a time-series graph, large changes can
Q75: Your boss asks you to graph company