Multiple Choice
The figure below shows the life expectancy for persons living in the U.S.A. 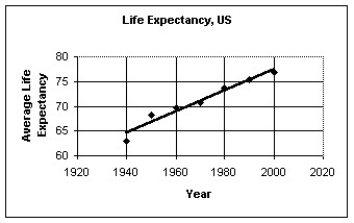 The regression analysis of the data yields the following values: R2 = 0.9539 Use the regression model to predict the life expectancy in 2015.
A) 81 years
B) 79 years
C) 84 years
D) 83 years
E) 80 years
Correct Answer:

Verified
Correct Answer:
Verified
Related Questions
Q1: A reporter studied the causes of
Q2: Which of the following scatterplots of residuals
Q4: A study of consumer behavior finds a
Q5: A college admissions officer in the U.S.A.,defending
Q6: The scatterplot below displays the yearly production
Q7: Which of the labeled points below are
Q8: The data in the table below
Q9: A study finds a strong positive association
Q10: The figure below shows the recent
Q11: The table below shows the age