Multiple Choice
The table below shows the gestation (in days) and average longevity (in years) for a number of different mammals: The scatter plot and regression equation are shown below: 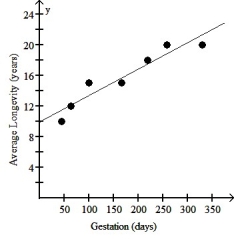 The regression analysis of this data yields the following values: R2 = 0.9048 Use this model to predict the average longevity of an African elephant whose gestation is 660 days.
A) 32.7 years
B) 38.7 years
C) 41.9 years
D) 22.8 years
E) 51.2 years
Correct Answer:

Verified
Correct Answer:
Verified
Q22: The figure below shows the association between
Q23: The figure below examines the association between
Q24: The table below displays the latitude
Q25: Which of the following scatterplots of residuals
Q26: Which of the labeled points below will
Q27: A university studied students' grades and established
Q28: Which of the labeled points below are
Q30: Over a period of years,a certain town
Q31: The total home-game attendance for major-league
Q32: Which of the labeled points below will