Multiple Choice
Over a period of years,a certain town observed the association between the number of people attending churches and the number of people in the city jail.The results are shown on the figure below.Also shown are the equation and R2 value from a linear regression analysis.What is the best conclusion to draw from the figure? 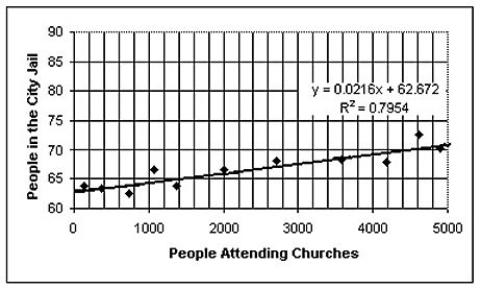
A) Although the association is negatively strong,going to church does not cause people to go to jail.Instead,size of the population in the town is probably a lurking variable that drives both the number of people in jail and the number of people attending church to increase together.
B) More detainees should go to church to improve their behavior.
C) Although the association is positively strong,going to church does not cause people to go to jail.Instead,size of the population of the town is probably a lurking variable that drives both the number of people in jail and the number of people attending church to increase together.
D) More people go to church not to go to jail.
E) Clearly,there must be some as-yet unknown problems associated with going to church.
Correct Answer:

Verified
Correct Answer:
Verified
Q22: The figure below shows the association between
Q23: The figure below examines the association between
Q24: The table below displays the latitude
Q25: Which of the following scatterplots of residuals
Q26: Which of the labeled points below will
Q27: A university studied students' grades and established
Q28: Which of the labeled points below are
Q29: The table below shows the gestation
Q31: The total home-game attendance for major-league
Q32: Which of the labeled points below will