Multiple Choice
Shown below are the boxplot,the histogram and summary statistics for the highest temperatures ever recorded (in °F) in 32 different states in the U.S.A.. 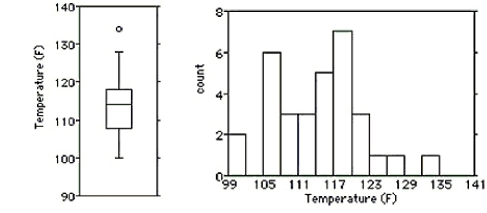 Write a few sentences describing the distribution.
A) The distribution is bimodal,symmetric with a mean of 114.2°F.There is a high outlier that should be investigated.The standard deviation is 7.7°F.The boxplot shows that half of the time,the highest temperatures were between about 107.5°F and 114°F.
B) The distribution is unimodal,symmetric enough with a mean of 114.2°F.There is a high outlier that should be investigated,but it does not influence the mean very much.The standard deviation is 7.7°F.The boxplot shows that half of the time,the highest temperatures were between about 107.5°F and 118°F.
C) The distribution is bimodal,essentially symmetric with a mean of 114.2°F.There is a high outlier that should be investigated,but it does not influence the mean very much.The standard deviation is 7.7°F.The boxplot shows that half of the time,the highest temperature were between about 107.5°F and 118°F.
D) The distribution is unimodal,essentially symmetric with a mean of 114.2°F.There is a high outlier that should be investigated,because it influences the mean.The standard deviation is 7.7°F.The boxplot shows that half of the time,the highest temperatures were between about 107.5°F and 114°F.
E) The distribution is unimodal,essentially symmetric with a mean of 114.2°F.There is a high outlier that should be investigated,but it does not influence the mean very much.The standard deviation is 7.7°F.The boxplot shows that half of the time,the highest temperatures were between about 107.5°F and 114°F.
Correct Answer:

Verified
Correct Answer:
Verified
Q1: A small company employs a supervisor at
Q2: Ontario wanted to find the typical size
Q3: A small company employs a supervisor at
Q4: During student-teacher negotiations at a certain high
Q6: The test scores of 15 students
Q7: The mathematics department at a Canadian
Q8: A business owner recorded her annual
Q9: The histograms show the cost of living,in
Q10: A local ice cream shop hand scoops
Q11: Here is an ogive of the distribution