Multiple Choice
Exhibit 16.5.The following data shows the demand for an airline ticket dependent on the price of this ticket. 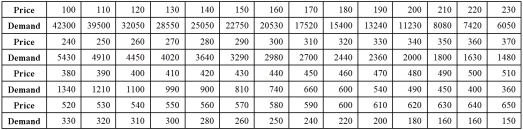 For the assumed cubic and log-log regression models,Demand = β0 + β1Price + β2Price2 + β3Price3 + ε and ln(Demand) = β0 + β1ln(Price) + ε,the following regression results are available:
 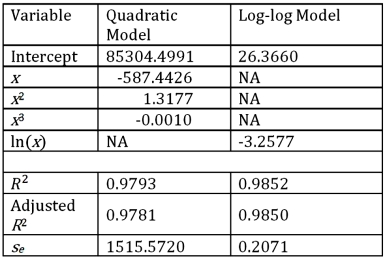 Refer to Exhibit 16.5.Using the cubic model,what is the predicted demand when the price is $200?
A) 14378.72
B) 9201.45
C) 10764.66
D) 12499.98
Correct Answer:

Verified
Correct Answer:
Verified
Q62: Exhibit 16-7.It is believed that the sales
Q63: Exhibit 16-4.The following data shows the cooling
Q64: Exhibit 16.2.Typically,the sales volume declines with an
Q65: Exhibit 16-7.It is believed that the sales
Q67: Exhibit 16.5.The following data shows the demand
Q68: Exhibit 16-7.It is believed that the sales
Q69: Exhibit 16-7.It is believed that the sales
Q70: Exhibit 16-1.The following Excel scatterplot with the
Q71: Exhibit 16-7.It is believed that the sales
Q85: The coefficient of determination R<sup>2</sup> cannot be