Short Answer
Exhibit 16-7.It is believed that the sales volume of one liter Pepsi bottles depends on the price of the bottle and the price of one liter bottle of Coca Cola.The following data has been collected for a certain sales region. 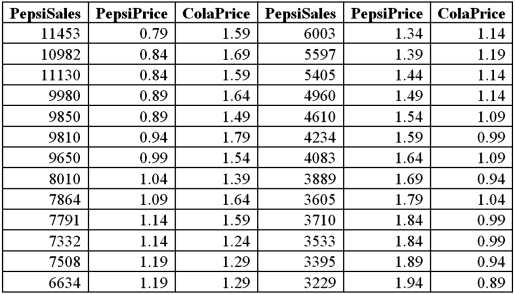 Using Excel's regression,the linear model PepsiSales = β0 + β1PepsiPrice + β2ColaPrice + ε and the log-log model ln(PepsiSales)= β0 + β1ln(PepsiPrice)+ β2ln(ColaPrice)+ ε have been estimated as follows:
 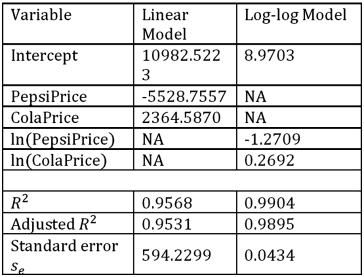 Refer to Exhibit 16.7.What is the percentage of variations in the sales of Pepsi explained by the estimated linear model?
Correct Answer:

Verified
Correct Answer:
Verified
Q28: A quadratic regression model is a special
Q63: Exhibit 16-4.The following data shows the cooling
Q64: Exhibit 16.2.Typically,the sales volume declines with an
Q65: Exhibit 16-7.It is believed that the sales
Q66: Exhibit 16.5.The following data shows the demand
Q67: Exhibit 16.5.The following data shows the demand
Q69: Exhibit 16-7.It is believed that the sales
Q70: Exhibit 16-1.The following Excel scatterplot with the
Q71: Exhibit 16-7.It is believed that the sales
Q72: Exhibit 16.5.The following data shows the demand