Multiple Choice
Exhibit 16-4.The following data shows the cooling temperatures of a freshly brewed cup of coffee after it is poured from the brewing pot into a serving cup.The brewing pot temperature is approximately 180º F;see http://mathbits.com/mathbits/tisection/statistics2/exponential.htm 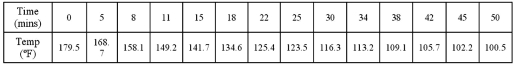 For the assumed exponential model ln(Temp) = β0 + β1Time + ε,the following Excel regression partial output is available.
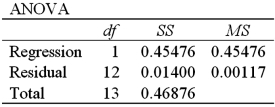
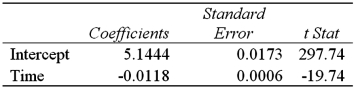 Refer to Exhibit 16-4.What is the regression equation for making predictions concerning the coffee temperature?
A) 
B) 
C) 
D) 
Correct Answer:

Verified
Correct Answer:
Verified
Q28: A quadratic regression model is a special
Q32: The fit of the models y =
Q46: The cubic regression model,y = β<sub>0</sub> +
Q70: Exhibit 16-1.The following Excel scatterplot with the
Q71: Exhibit 16-7.It is believed that the sales
Q72: Exhibit 16.5.The following data shows the demand
Q74: For the quadratic equation <img src="https://d2lvgg3v3hfg70.cloudfront.net/TB2339/.jpg" alt="For
Q76: Exhibit 16.2.Typically,the sales volume declines with an
Q77: When the data is available on x
Q80: Exhibit 16-4.The following data shows the cooling