Multiple Choice
Exhibit 16-1.The following Excel scatterplot with the fitted quadratic regression equation illustrates the observed relationship between productivity and the number of hired workers. 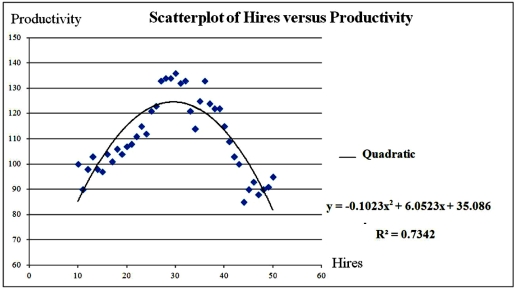 Refer to Exhibit 16.1.Assuming that the number of hired workers must be integer,how many workers should be hired in order to achieve the highest productivity?
A) 26
B) 28
C) 30
D) 32
Correct Answer:

Verified
Correct Answer:
Verified
Q28: A quadratic regression model is a special
Q65: Exhibit 16-7.It is believed that the sales
Q66: Exhibit 16.5.The following data shows the demand
Q67: Exhibit 16.5.The following data shows the demand
Q68: Exhibit 16-7.It is believed that the sales
Q69: Exhibit 16-7.It is believed that the sales
Q71: Exhibit 16-7.It is believed that the sales
Q72: Exhibit 16.5.The following data shows the demand
Q74: For the quadratic equation <img src="https://d2lvgg3v3hfg70.cloudfront.net/TB2339/.jpg" alt="For
Q75: Exhibit 16-4.The following data shows the cooling