Essay
Exhibit 16-7.It is believed that the sales volume of one liter Pepsi bottles depends on the price of the bottle and the price of one liter bottle of Coca Cola.The following data has been collected for a certain sales region. 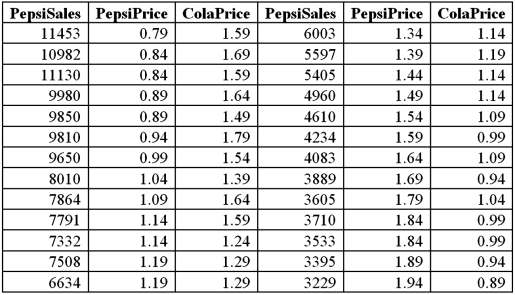 Using Excel's regression,the linear model PepsiSales = β0 + β1PepsiPrice + β2ColaPrice + ε and the log-log model ln(PepsiSales)= β0 + β1ln(PepsiPrice)+ β2ln(ColaPrice)+ ε have been estimated as follows:
 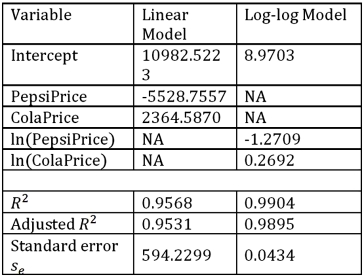 Refer to Exhibit 16.7.Discuss the choice between the linear model and the log-log model.
Correct Answer:

Verified
Both models,PepsiSales = β0 + β1PepsiPrice...View Answer
Unlock this answer now
Get Access to more Verified Answers free of charge
Correct Answer:
Verified
View Answer
Unlock this answer now
Get Access to more Verified Answers free of charge
Q28: A quadratic regression model is a special
Q66: Exhibit 16.5.The following data shows the demand
Q67: Exhibit 16.5.The following data shows the demand
Q68: Exhibit 16-7.It is believed that the sales
Q69: Exhibit 16-7.It is believed that the sales
Q70: Exhibit 16-1.The following Excel scatterplot with the
Q72: Exhibit 16.5.The following data shows the demand
Q74: For the quadratic equation <img src="https://d2lvgg3v3hfg70.cloudfront.net/TB2339/.jpg" alt="For
Q75: Exhibit 16-4.The following data shows the cooling
Q76: Exhibit 16.2.Typically,the sales volume declines with an