Multiple Choice
Exhibit 16.5.The following data shows the demand for an airline ticket dependent on the price of this ticket. 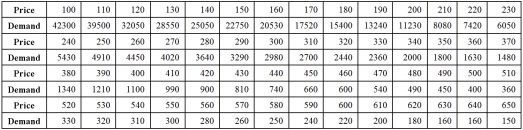 For the assumed cubic and log-log regression models,Demand = β0 + β1Price + β2Price2 + β3Price3 + ε and ln(Demand) = β0 + β1ln(Price) + ε,the following regression results are available:
 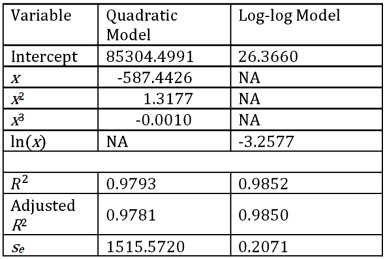 Refer to Exhibit 16.5.What is the percentage of variations in ln(Demand) explained by the log-log regression equation?
A) 98.52%
B) 98.50%
C) 91.39%
D) 97.93%
Correct Answer:

Verified
Correct Answer:
Verified
Q28: A quadratic regression model is a special
Q67: Exhibit 16.5.The following data shows the demand
Q68: Exhibit 16-7.It is believed that the sales
Q69: Exhibit 16-7.It is believed that the sales
Q70: Exhibit 16-1.The following Excel scatterplot with the
Q71: Exhibit 16-7.It is believed that the sales
Q74: For the quadratic equation <img src="https://d2lvgg3v3hfg70.cloudfront.net/TB2339/.jpg" alt="For
Q75: Exhibit 16-4.The following data shows the cooling
Q76: Exhibit 16.2.Typically,the sales volume declines with an
Q77: When the data is available on x