Multiple Choice
Exhibit 12.5 In the following table,individuals are cross-classified by their age group and income level. 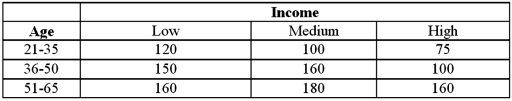 Refer to Exhibit 12.5.Which of the following is the expected joint probability for the 'low income and 21-35 age group' cell assuming age group and income are independent?
A) 0.0830
B) 0.0874
C) 0.0996
D) 0.1328
Correct Answer:

Verified
Correct Answer:
Verified
Q18: For the goodness-of-fit test,the expected category frequencies
Q42: MARS claims that Skittles candies should be
Q77: Exhibit 12-1 A card dealing machine deals
Q78: Exhibit 12.6 The following table shows the
Q80: The following table shows numerical summaries of
Q81: Exhibit 12.5 In the following table,individuals are
Q83: Exhibit 12.3 A fund manager wants to
Q84: Exhibit 12.4 In the following table,likely voters'
Q85: The following table shows the observed frequencies
Q87: Exhibit 12.8 The heights (in cm)for a