Essay
The following table shows numerical summaries of the worst quarter returns (in percentages)for a sample of 121 hedge funds. 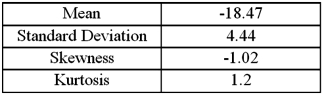
A)Set up the competing hypotheses for the Jarque-Bera test for normality for the worst quarter returns.
B)Calculate the value of the test statistic and find the p-value.
C)Does the evidence suggest the worst quarter returns do not have a normal distribution at the 5% significance level?
Correct Answer:

Verified
 The test statistic value is given by
JB...View Answer
Unlock this answer now
Get Access to more Verified Answers free of charge
Correct Answer:
Verified
JB...
View Answer
Unlock this answer now
Get Access to more Verified Answers free of charge
Q18: For the goodness-of-fit test,the expected category frequencies
Q75: Exhibit 12.4 In the following table,likely voters'
Q76: Exhibit 12.2 A university has six colleges
Q77: Exhibit 12-1 A card dealing machine deals
Q78: Exhibit 12.6 The following table shows the
Q81: Exhibit 12.5 In the following table,individuals are
Q82: Exhibit 12.5 In the following table,individuals are
Q83: Exhibit 12.3 A fund manager wants to
Q84: Exhibit 12.4 In the following table,likely voters'
Q85: The following table shows the observed frequencies