Multiple Choice
Exhibit 12.5 In the following table,individuals are cross-classified by their age group and income level. 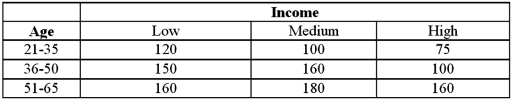 Refer to Exhibit 12.5.For the chi-square test of independence,the value of the test statistic is:
A) 8.779
B) 10.840
C) 13.243
D) 16.159
Correct Answer:

Verified
Correct Answer:
Verified
Q18: For the goodness-of-fit test,the expected category frequencies
Q42: MARS claims that Skittles candies should be
Q76: Exhibit 12.2 A university has six colleges
Q77: Exhibit 12-1 A card dealing machine deals
Q78: Exhibit 12.6 The following table shows the
Q80: The following table shows numerical summaries of
Q82: Exhibit 12.5 In the following table,individuals are
Q83: Exhibit 12.3 A fund manager wants to
Q84: Exhibit 12.4 In the following table,likely voters'
Q85: The following table shows the observed frequencies