Essay
The following table shows the observed frequencies of the quarterly returns for a sample of 60 hedge funds.The table also contains the hypothesized proportions of each class assuming the quarterly returns have a normal distribution.The sample mean and standard deviation are 3.6% and 7.4% respectively. 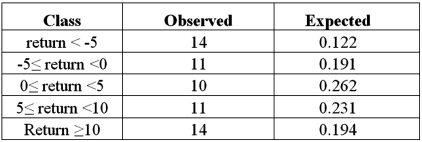
A)Set up the competing hypotheses for the goodness-of-fit test of normality for the quarterly returns.
B)Calculate the value of the test statistic and determine the degrees of freedom.
C)Compute the p-value.Does the evidence suggest that the quarterly returns do not have a normal distribution at the 10% significance level?
Correct Answer:

Verified
 The test statistic is given by and the...
View Answer
Unlock this answer now
Get Access to more Verified Answers free of charge
Correct Answer:
Verified
View Answer
Unlock this answer now
Get Access to more Verified Answers free of charge
Q42: MARS claims that Skittles candies should be
Q80: The following table shows numerical summaries of
Q81: Exhibit 12.5 In the following table,individuals are
Q82: Exhibit 12.5 In the following table,individuals are
Q83: Exhibit 12.3 A fund manager wants to
Q84: Exhibit 12.4 In the following table,likely voters'
Q87: Exhibit 12.8 The heights (in cm)for a
Q88: If a test statistic has a value
Q89: Exhibit 12.2 A university has six colleges
Q90: Exhibit 12.4 In the following table,likely voters'