Multiple Choice
The accompanying chart shows the number of books written by each author in a collection of cookbooks.What type of data is being represented? 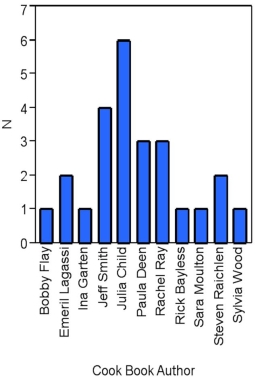
A) Quantitative,ordinal
B) Quantitative,ratio
C) Qualitative,nominal
D) Qualitative,ordinal
Correct Answer:

Verified
Correct Answer:
Verified
Q13: When constructing a scatterplot for two quantitative
Q46: Exhibit 2-5.The following data represent scores on
Q47: What type of relationship is indicated in
Q48: Exhibit 2-11.The accompanying relative frequency distribution represents
Q49: Exhibit 2-13.The organization of the Girl Sprouts
Q51: A statistics instructor computes the grade and
Q53: Exhibit 2-2.The following is a list of
Q54: Exhibit 2-9.An analyst constructed the following frequency
Q55: In the following pie chart representing a
Q79: An ogive is a graph that plots