Multiple Choice
Exhibit 2-13.The organization of the Girl Sprouts has completed its annual cookie drive.The sales are reported in the accompanying ogive. 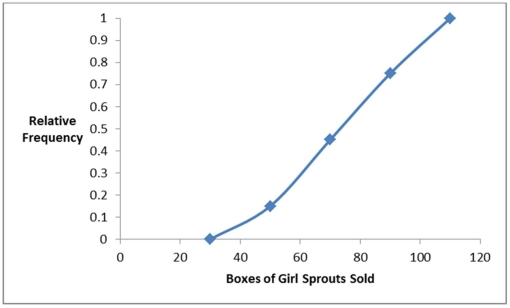 Refer to Exhibit 2-13.Approximate the percentage of girls who sold less than 90 boxes of cookies.
A) 45%
B) 55%
C) 65%
D) 75%
Correct Answer:

Verified
Correct Answer:
Verified
Q13: When constructing a scatterplot for two quantitative
Q44: Exhibit 2-8.Consider the following frequency distribution. <img
Q46: Exhibit 2-5.The following data represent scores on
Q47: What type of relationship is indicated in
Q48: Exhibit 2-11.The accompanying relative frequency distribution represents
Q50: The accompanying chart shows the number of
Q51: A statistics instructor computes the grade and
Q53: Exhibit 2-2.The following is a list of
Q54: Exhibit 2-9.An analyst constructed the following frequency
Q79: An ogive is a graph that plots