Multiple Choice
Exhibit 2-2.The following is a list of five of the world's busiest airports by passenger traffic for 2010. 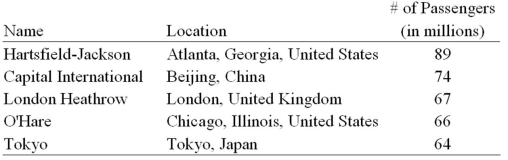 Refer to Exhibit 2-2.How many more millions of passengers flew out of Atlanta than flew out of Chicago?
A) 13
B) 21
C) 23
D) 25
Correct Answer:

Verified
Correct Answer:
Verified
Q9: A scatterplot is a graphical tool that
Q25: Exhibit 2-7.Thirty students at Eastside High School
Q27: The following table shows analyst sentiment ratings
Q28: Exhibit 2-14.In the accompanying stem-and-leaf diagram,the values
Q29: Exhibit 2-6.The following data represent the recent
Q31: The following histogram represents the number of
Q32: The following histogram represents the number of
Q33: Exhibit 2-14.In the accompanying stem-and-leaf diagram,the values
Q34: Exhibit 2-4.Students in Professor Smith's Business Statistics
Q110: A pie chart is a segmented circle