Multiple Choice
Exhibit 2-14.In the accompanying stem-and-leaf diagram,the values in the stem and leaf portions represent 10s and 1s digits,respectively. 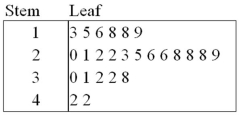 Refer to Exhibit 2-14.How many values are at least 25 but less than 35?
A) 10
B) 11
C) 12
D) 13
Correct Answer:

Verified
Correct Answer:
Verified
Q9: A scatterplot is a graphical tool that
Q23: Exhibit 2-10.Automobiles traveling on a road with
Q24: What type of relationship is indicated in
Q25: Exhibit 2-7.Thirty students at Eastside High School
Q27: The following table shows analyst sentiment ratings
Q29: Exhibit 2-6.The following data represent the recent
Q30: Exhibit 2-2.The following is a list of
Q31: The following histogram represents the number of
Q32: The following histogram represents the number of
Q33: Exhibit 2-14.In the accompanying stem-and-leaf diagram,the values