Multiple Choice
Exhibit 2-6.The following data represent the recent sales price (in $1,000s) of 24 homes in a Midwestern city. 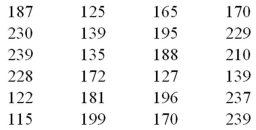 Refer to Exhibit 2-6.Suppose the data on house prices will be grouped into five classes.The width of the classes for a frequency distribution or histogram is closest to ______.
A) 15
B) 20
C) 25
D) 30
Correct Answer:

Verified
Correct Answer:
Verified
Q9: A scatterplot is a graphical tool that
Q24: What type of relationship is indicated in
Q25: Exhibit 2-7.Thirty students at Eastside High School
Q27: The following table shows analyst sentiment ratings
Q28: Exhibit 2-14.In the accompanying stem-and-leaf diagram,the values
Q30: Exhibit 2-2.The following is a list of
Q31: The following histogram represents the number of
Q32: The following histogram represents the number of
Q33: Exhibit 2-14.In the accompanying stem-and-leaf diagram,the values
Q34: Exhibit 2-4.Students in Professor Smith's Business Statistics