Multiple Choice
Exhibit 2-7.Thirty students at Eastside High School took the SAT on the same Saturday.Their raw scores are given next. 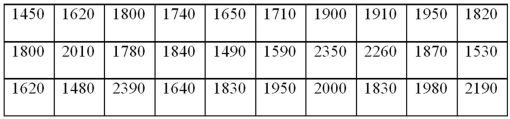 Refer to Exhibit 2-7.Consider a frequency distribution of the data that groups the data in classes of 1400 up to 1600,1600 up to 1800,1800 up to 2000,and so on.What graphical tool would you use to display the cumulative relative frequency of the grouped data?
A) Ogive
B) Polygon
C) Pie Chart
D) Bar Chart
Correct Answer:

Verified
Correct Answer:
Verified
Q9: A scatterplot is a graphical tool that
Q20: To approximate the width of a class
Q21: Exhibit 2-4.Students in Professor Smith's Business Statistics
Q22: Exhibit 2-11.The accompanying relative frequency distribution represents
Q23: Exhibit 2-10.Automobiles traveling on a road with
Q24: What type of relationship is indicated in
Q27: The following table shows analyst sentiment ratings
Q28: Exhibit 2-14.In the accompanying stem-and-leaf diagram,the values
Q29: Exhibit 2-6.The following data represent the recent
Q30: Exhibit 2-2.The following is a list of