Multiple Choice
The following stem-and-leaf diagram shows the speeds in miles per hour (mph) of 14 cars approaching a toll booth on a bridge in Oakland,California. 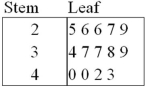 How many of the cars were traveling faster than 25 mph but slower than 40 mph?
A) 8
B) 9
C) 10
D) 12
Correct Answer:

Verified
Correct Answer:
Verified
Q23: What graphical tool is best used to
Q28: For which of the following data sets
Q51: A stem-and-leaf diagram is constructed by separating
Q59: What type of relationship is indicated in
Q60: Exhibit 2-3.A city in California spent six
Q61: Exhibit 2-4.Students in Professor Smith's Business Statistics
Q63: Exhibit 2-5.The following data represent scores on
Q65: Exhibit 2-11.The accompanying relative frequency distribution represents
Q66: A high school football league recorded the
Q67: A car dealership created a scatterplot showing