Multiple Choice
Exhibit 2-5.The following data represent scores on a pop quiz in a statistics section: 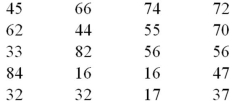 Refer to Exhibit 2-5.Suppose the data is grouped into five classes,and one of them will be "30 up to 44"-that is,{x;30 ≤ x < 44}.The relative frequency of this class is ____.
A) 0.20
B) 0.25
C) 4
D) 5
Correct Answer:

Verified
Correct Answer:
Verified
Q23: What graphical tool is best used to
Q51: A stem-and-leaf diagram is constructed by separating
Q59: What type of relationship is indicated in
Q60: Exhibit 2-3.A city in California spent six
Q61: Exhibit 2-4.Students in Professor Smith's Business Statistics
Q62: The following stem-and-leaf diagram shows the speeds
Q65: Exhibit 2-11.The accompanying relative frequency distribution represents
Q66: A high school football league recorded the
Q67: A car dealership created a scatterplot showing
Q68: Exhibit 2-8.Consider the following frequency distribution. <img