Multiple Choice
Exhibit 2-8.Consider the following frequency distribution. 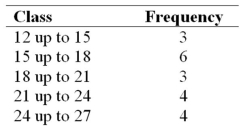 Refer to Exhibit 2-8.How many observations are less than 21?
A) 6
B) 12
C) 18
D) 24
Correct Answer:

Verified
Correct Answer:
Verified
Related Questions
Q32: The percent frequency of a category equals
Q78: Exhibit 2-7.Thirty students at Eastside High School
Q80: Exhibit 2-6.The following data represent the recent
Q81: The accompanying table shows students' scores from
Q84: How does an ogive differ from a
Q85: When displaying quantitative data,what is an ogive
Q86: Exhibit 2-7.Thirty students at Eastside High School
Q87: For quantitative data,a cumulative frequency distribution records
Q107: The relative frequency of a category is
Q120: Frequency distributions may be used to describe