Multiple Choice
The accompanying table shows students' scores from the final exam in a history course. 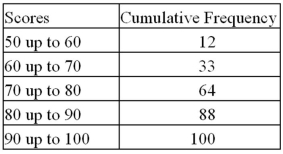 How many of the students scored at least 70 but less than 90?
A) 24
B) 31
C) 55
D) 88
Correct Answer:

Verified
Correct Answer:
Verified
Related Questions
Q32: The percent frequency of a category equals
Q76: Exhibit 2-9.An analyst constructed the following frequency
Q78: Exhibit 2-7.Thirty students at Eastside High School
Q80: Exhibit 2-6.The following data represent the recent
Q82: Exhibit 2-8.Consider the following frequency distribution. <img
Q84: How does an ogive differ from a
Q85: When displaying quantitative data,what is an ogive
Q86: Exhibit 2-7.Thirty students at Eastside High School
Q107: The relative frequency of a category is
Q120: Frequency distributions may be used to describe