Multiple Choice
Exhibit 2-8.Consider the following frequency distribution. 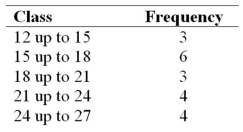 Refer to Exhibit 2-8.How many observations are at least 15 but less than 18?
A) 3
B) 4
C) 5
D) 6
Correct Answer:

Verified
Correct Answer:
Verified
Related Questions
Q18: For both qualitative and quantitative data, what
Q51: A stem-and-leaf diagram is constructed by separating
Q63: Exhibit 2-5.The following data represent scores on
Q65: Exhibit 2-11.The accompanying relative frequency distribution represents
Q66: A high school football league recorded the
Q67: A car dealership created a scatterplot showing
Q69: The following data represent the ages of
Q70: Johnson and Johnson (JNJ)is a consumer staples
Q72: The dividend yields of the stocks in
Q90: For quantitative data, a cumulative relative frequency