Essay
A high school football league recorded the average points scored per game,as well as the winning percentage for the 10 teams in the league. 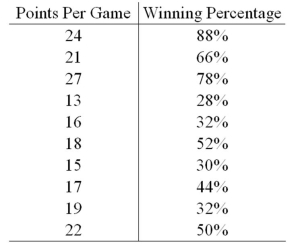 Construct a scatterplot.Does scoring more points appear to be associated with a higher winning percentage?
Correct Answer:

Verified
Teams with higher po...View Answer
Unlock this answer now
Get Access to more Verified Answers free of charge
Correct Answer:
Verified
View Answer
Unlock this answer now
Get Access to more Verified Answers free of charge
Q18: For both qualitative and quantitative data, what
Q51: A stem-and-leaf diagram is constructed by separating
Q61: Exhibit 2-4.Students in Professor Smith's Business Statistics
Q62: The following stem-and-leaf diagram shows the speeds
Q63: Exhibit 2-5.The following data represent scores on
Q65: Exhibit 2-11.The accompanying relative frequency distribution represents
Q67: A car dealership created a scatterplot showing
Q68: Exhibit 2-8.Consider the following frequency distribution. <img
Q69: The following data represent the ages of
Q70: Johnson and Johnson (JNJ)is a consumer staples