Essay
The dividend yields of the stocks in an investor's portfolio are shown in the following cumulative relative frequency distribution. 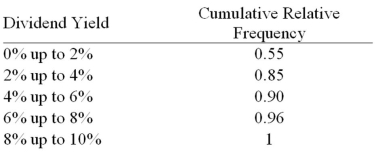 a.Construct an ogive.
B)Approximately what percent of the stocks had a dividend yield of 3% or larger?
Correct Answer:

Verified
a.  b.Approximately ...
View Answer
Unlock this answer now
Get Access to more Verified Answers free of charge
Correct Answer:
Verified
View Answer
Unlock this answer now
Get Access to more Verified Answers free of charge
Q18: For both qualitative and quantitative data, what
Q67: A car dealership created a scatterplot showing
Q68: Exhibit 2-8.Consider the following frequency distribution. <img
Q69: The following data represent the ages of
Q70: Johnson and Johnson (JNJ)is a consumer staples
Q74: The following stem-and-leaf diagram shows the last
Q75: Exhibit 2-10.Automobiles traveling on a road with
Q76: Exhibit 2-9.An analyst constructed the following frequency
Q84: How does an ogive differ from a
Q90: For quantitative data, a cumulative relative frequency