Multiple Choice
Exhibit 2-6.The following data represent the recent sales price (in $1,000s) of 24 homes in a Midwestern city. 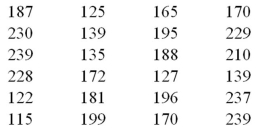 Refer to Exhibit 2-6.Suppose the data is grouped into five classes,and one of them will be "165 up to 190"- that is,{x;165 ≤ x < 190}.The frequency of this class is ____.
A) 6/24
B) 7/24
C) 6
D) 7
Correct Answer:

Verified
Correct Answer:
Verified
Q32: The percent frequency of a category equals
Q75: Exhibit 2-10.Automobiles traveling on a road with
Q76: Exhibit 2-9.An analyst constructed the following frequency
Q78: Exhibit 2-7.Thirty students at Eastside High School
Q81: The accompanying table shows students' scores from
Q82: Exhibit 2-8.Consider the following frequency distribution. <img
Q84: How does an ogive differ from a
Q85: When displaying quantitative data,what is an ogive
Q107: The relative frequency of a category is
Q120: Frequency distributions may be used to describe