Multiple Choice
Exhibit 2-8.Consider the following frequency distribution. 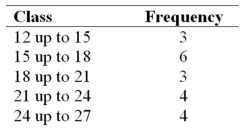 Refer to Exhibit 2-8.What proportion of the observations are at least 15 but less than 18?
A) 0.20
B) 0.25
C) 0.30
D) 0.35
Correct Answer:

Verified
Correct Answer:
Verified
Related Questions
Q7: Exhibit 2-1.An auto parts chain asked customers
Q8: A hair stylist records the hair color
Q11: Each month the Bureau of Labor Statistics
Q13: The following table lists some of the
Q14: The following table shows average wind speeds
Q15: Exhibit 2-14.In the accompanying stem-and-leaf diagram,the values
Q16: The following histogram represents the number of
Q17: The following table shows the number of
Q27: A histogram is a series of rectangles
Q75: A stem-and-leaf diagram is useful in that