Essay
The following table shows average wind speeds (in miles per hour)during 15 major fires in California. 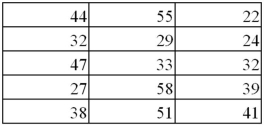 Construct a stem-and-leaf diagram.Were most of these storms fueled by 45+ mile-per-hour winds? Explain.
Correct Answer:

Verified
No,most of the time the averag...View Answer
Unlock this answer now
Get Access to more Verified Answers free of charge
Correct Answer:
Verified
View Answer
Unlock this answer now
Get Access to more Verified Answers free of charge
Q11: Each month the Bureau of Labor Statistics
Q12: Exhibit 2-8.Consider the following frequency distribution. <img
Q13: The following table lists some of the
Q15: Exhibit 2-14.In the accompanying stem-and-leaf diagram,the values
Q16: The following histogram represents the number of
Q17: The following table shows the number of
Q18: Exhibit 2-14.In the accompanying stem-and-leaf diagram,the values
Q19: Exhibit 2-4.Students in Professor Smith's Business Statistics
Q27: A histogram is a series of rectangles
Q75: A stem-and-leaf diagram is useful in that