Essay
Each month the Bureau of Labor Statistics reports the number of people (in thousands)employed in the United States by age.The accompanying frequency distribution shows the results for August 2011 (Source: http://data.bls.gov/pdq/SurveyOutputServlet). 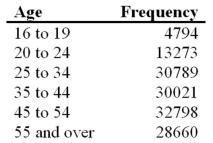 a.Construct a relative frequency distribution.What proportion of workers is between 20 and 24 years old?
B)Construct a cumulative relative frequency distribution.What proportion of workers is younger than 35 years old?
C)Construct a relative frequency histogram.
Correct Answer:

Verified
a.See the accompanyi...View Answer
Unlock this answer now
Get Access to more Verified Answers free of charge
Correct Answer:
Verified
View Answer
Unlock this answer now
Get Access to more Verified Answers free of charge
Q6: Exhibit 2-8.Consider the following frequency distribution. <img
Q7: Exhibit 2-1.An auto parts chain asked customers
Q8: A hair stylist records the hair color
Q12: Exhibit 2-8.Consider the following frequency distribution. <img
Q13: The following table lists some of the
Q14: The following table shows average wind speeds
Q15: Exhibit 2-14.In the accompanying stem-and-leaf diagram,the values
Q16: The following histogram represents the number of
Q27: A histogram is a series of rectangles
Q75: A stem-and-leaf diagram is useful in that