Multiple Choice
Exhibit 2-8.Consider the following frequency distribution. 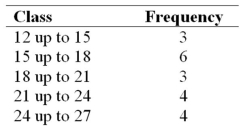 Refer to Exhibit 2-8.What proportion of the observations are less than 21?
A) 0.30
B) 0.60
C) 0.90
D) 1
Correct Answer:

Verified
Correct Answer:
Verified
Related Questions
Q1: The following table shows the prices (in
Q2: Construct a stem-and-leaf diagram for the following
Q3: The following table displays the top 40
Q5: In order to summarize qualitative data,a useful
Q7: Exhibit 2-1.An auto parts chain asked customers
Q8: A hair stylist records the hair color
Q11: Each month the Bureau of Labor Statistics
Q27: A histogram is a series of rectangles
Q75: A stem-and-leaf diagram is useful in that
Q123: Which of the following best describes a