Essay
The following table displays the top 40 American League batting averages of the 2011 season. 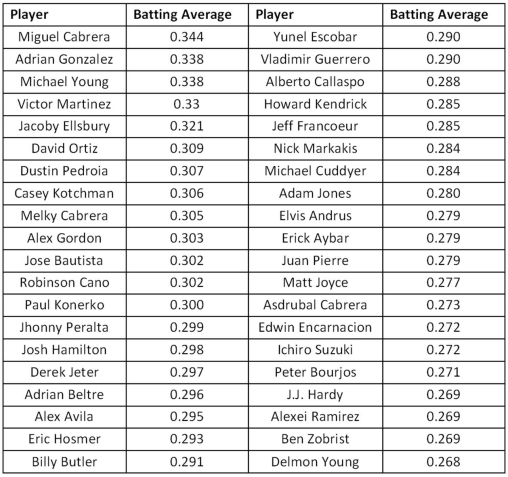 Source: http://www.espn.com
A)Construct frequency,relative frequency,and cumulative relative frequency distributions that group the data in classes of 0.265 up to 0.280,0.280 up to 0.295,0.295 up to 0.310,and so on.
B)How many of these players have a batting average above 0.340? What proportion of these players has a batting average of at least 0.280,but below 0.295? What percentage of these players has a batting average below 0.325?
C)Construct a relative frequency histogram.Is the distribution symmetric? If not,is it positively or negatively skewed?
D)Construct an ogive.
E)Using the ogive,approximately what proportion of the players in this group has a batting average above 0.290?
Correct Answer:

Verified
Correct Answer:
Verified
Q1: The following table shows the prices (in
Q2: Construct a stem-and-leaf diagram for the following
Q5: In order to summarize qualitative data,a useful
Q6: Exhibit 2-8.Consider the following frequency distribution. <img
Q7: Exhibit 2-1.An auto parts chain asked customers
Q8: A hair stylist records the hair color
Q11: Each month the Bureau of Labor Statistics
Q27: A histogram is a series of rectangles
Q75: A stem-and-leaf diagram is useful in that
Q123: Which of the following best describes a